Spectrum 2 User Manual
Contents
- FAQ
- Introduction
- Downloading the Plugin
- Plugin Installation
- License Management & Activation
- Basic Operation / First Steps
- Multi-Channel Operations
- Naming, coloring, and re-ordering tracks
- Hiding Tracks
- Settings and Top Bar
- Plugin Color Selector
- Preset Manager
- Additional Top Bar Functions
- Bottom Bar (Main Controls)
- Mouse Spectrum Scanning
- Conclusion
1. FAQ
Q: I'm on Windows and my DAW crashes when I load the Plug-In, but the standalone versions works just fine.
A: This crash may be caused by buggy AMD Drivers. Uninstall current drivers via AMD Cleanup Utility. afterwards install 25.10.2
2. Introduction
Spectrum 2 is an upgraded version of our classic spectral analysis tool.
Available in all major plugin formats (AU, VST, AAX), Spectrum 2 also features a standalone version for use outside of a DAW.
Try Spectrum 2 yourself - download the free trial, or purchase a full license from the Product Page.
In addition to this guide, you can hover over the UI elements within the plugin to display a tooltip with helpful information.
This manual helps you get the most Spectrum 2 and is split into two sections.
- Setup Steps
- Main Features
Setup Steps
3. Downloading the Plugin
Both plugin and standalone versions are downloaded as either a .pkg file for macOS or a .exe installer for Windows.
You can find the download links on the product page.
The trial and full version use the same installers - but the trial has time limitations.
Purchasing a full license removes the trial’s time limit.
4. Plugin Installation
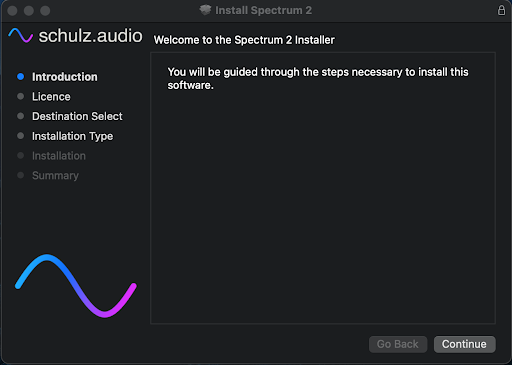
After downloading, run the installer to start the installation process, following the wizard.
Install the plugin to the correct VST folder location. Otherwise, you need to redirect your DAW to search for the correct directory.
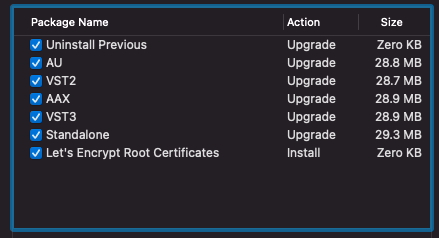
During the installation, you will be prompted to choose which versions to install.
Installation Notes
- On Windows, it is recommended to uninstall the older version via “add/remove programs”, or “Uninstall Previous” before installing the new file.
- Close your DAW before uninstalling or re-installing.
5. License Management & Activation
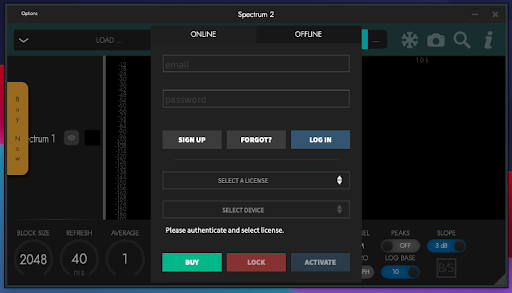
You will be prompted to verify your Spectrum 2 license after running the plugin for the first time.
For more information on this process, see our resource on License Management.
NOTE - if you have trouble typing in the plugin version, try authorizing in the standalone version. Sometimes DAW shortcuts override the text input.
Main Features and Functions
6. Basic Operation / First Steps
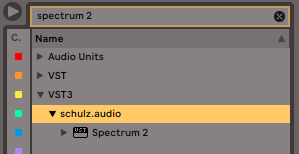
If everything was installed correctly, you will be able to find Spectrum 2 in your DAW’s browser.
You may need to rescan your DAW’s plugin folder to find Spectrum 2.
Simply create an instance of the plugin at any point in the signal chain you wish to monitor. Spectrum 2 is a multi-channel monitoring plugin, meaning you can stick instances of the plugin all over your project, and they all communicate with each other, so you can view all the data in one plugin.
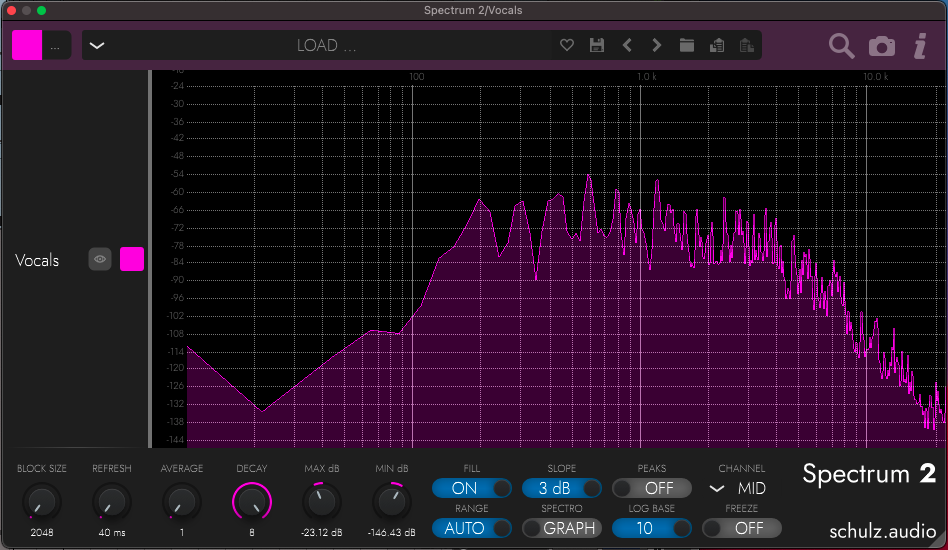
Start by inserting a single instance, then play your project to activate the spectrum. You will see the frequency information for whichever track you inserted the plugin.
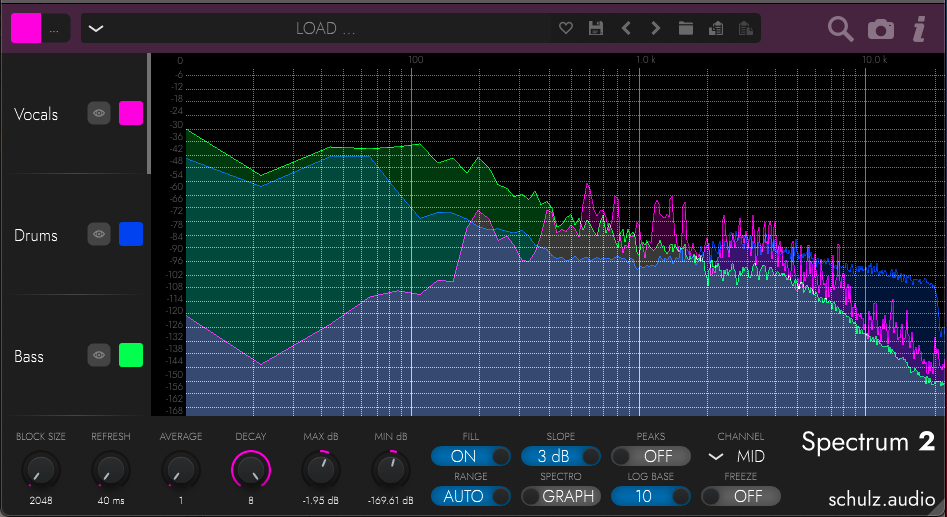
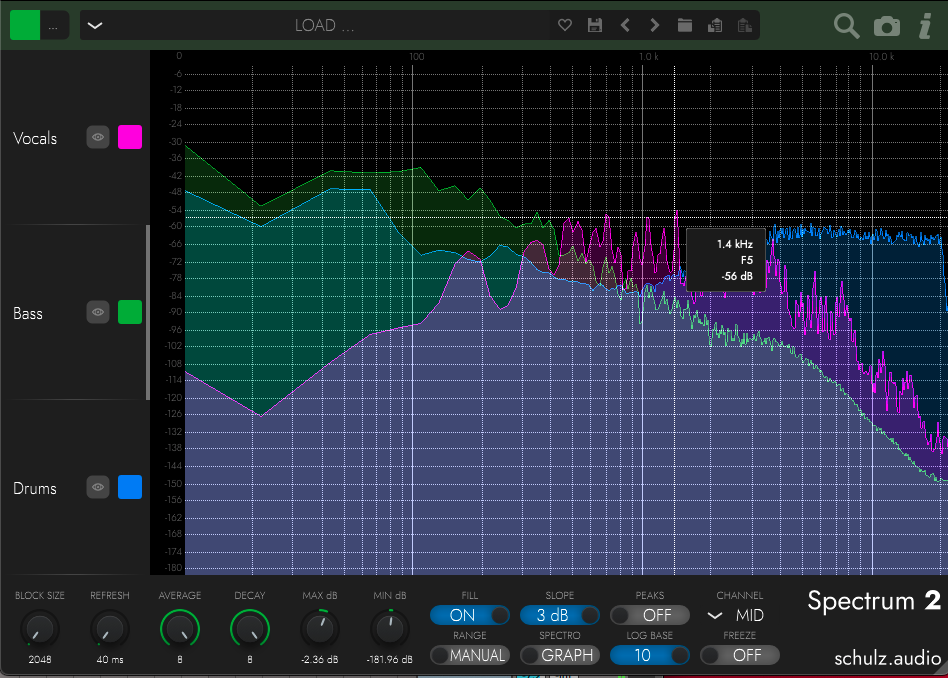
The X-axis shows the frequency spectrum, and the Y-axis displays the volume for each frequency. There are rulers on each axis that provide number measurements.
7. Multi-Channel Operations
This is more than a standard Spectrum… To get a taste of the multi-channel functionality, insert a second instance of Spectrum 2 on a different track in your project.
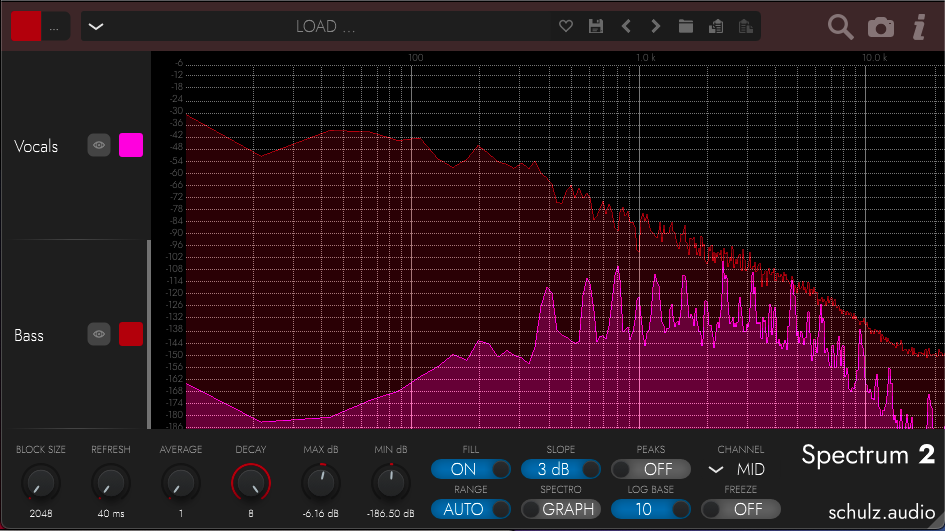
In the first example, we used a Drum channel and a Bass channel. You will see the two spectrums overlaid in the window.
You can insert as many instances of the plugin around your project as your PC can handle.

Here we’ve used it on four-track - Drum, Bass, Lead Synth, and Vocals. You can now see how the frequencies of all these tracks correlate.
Before looking at the more advanced features and settings, let’s have a look at how to organize the plugin properly.
8. Naming, coloring, and re-ordering tracks
Changing Channel Colors
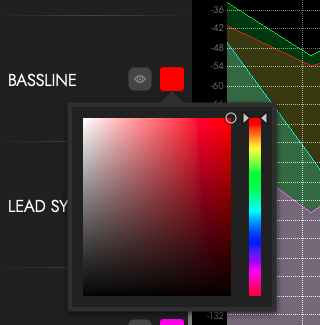
One of the first things you should do is change the colors of each channel to help distinguish the spectrum. If all the tracks use the same color, it makes it harder to work out what you are looking at.
You can change the color for each track independently by clicking the colored square on the track, then selecting a new color from the pop-up window.
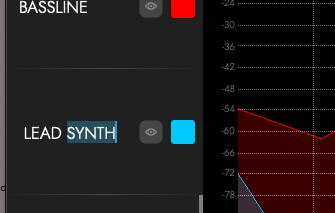
Renaming Tracks
In most DAWs, when you rename the track in your project, Spectrum 2 automatically updates the corresponding channel name to match. You can also change the track name by clicking the name in the plugin display, then typing in a new name.
Reordering Tracks
Channels in Spectrum 2 are easily reordered, simply drag and drop the track to the desired place. This makes it easier when laying out large multi-channel sessions.
9. Hiding Tracks
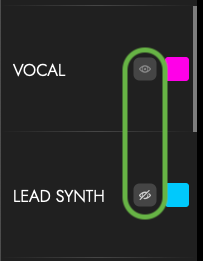
Each track has a toggle for Hide/Show.
This is useful for temporarily removing tracks, enabling you to get a better view if it gets cluttered.
Each instance of the plugin stores information on which tracks are hidden separately. This means you can configure different instances to only show certain things. So you could have one plugin showing all the drum stems, another showing all the guitars, and a third showing a combination of everything.
This helps with mixing workflows and makes the plugin more powerful.
11. Plugin Color Selector
This setting in the top bar changes the channel color of the selected instance. You will notice both the channel’s spectrum and the top bar changes color to match. This helps you to identify which instance of the plugin you have opened.
Clicking the “...” button to the left of the color square opens another color setting window, but this controls the whole plugin, rather than just the channel spectrum.
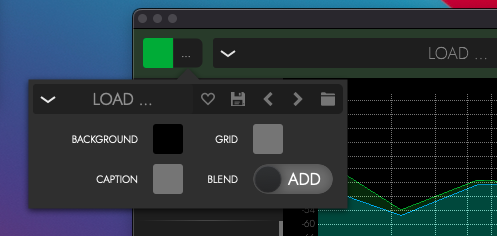
This gives you more control over the display of the plugin and lets you change the colors of the background, the grid, and modify the color blending mode.
You can also save and recall presets for these color settings.
12. Preset Manager
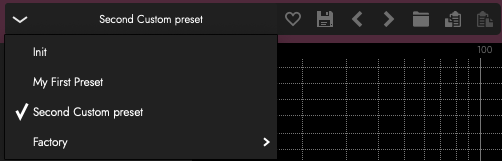
The top bar contains the interface for the preset manager. This lets you save and recall Spectrum 2 configurations for later use. This bar has buttons for:
- Loading presets from the drop-down menu.
- Save as new preset.
- Marking presets as Favorites.
- Quick swapping to the next/previous preset
- Open the preset folder directory in your computer's file browser.
- Copy and paste preset settings.
Presets save and recall any changed values of the plugin, including color information.
13. Additional Top Bar Functions
The top bar contains a few extra buttons:
From left to right, these buttons are:
- Screenshot - Takes a screenshot of the plugin window and saves it to your desktop.
- Solo View - Only displays the waveform for the currently selected channel. All other spectrums are hidden.
- Info - Opens the info and license display panel.
14. Bottom Bar (Main Controls)
At the bottom of the plugin window, there is a bar filled with additional controls.
These provide an advanced level of customization over the performance of the plugin and enable you to tweak the analysis to show exactly what you need to look at.
From Left To right
Block Size - (2048-16384)
Changes the resolution of the spectrum display via the FFT sizer. Higher values result in a better resolution but increased CPU load. Lower values have better performance but lower resolution. When analyzing low frequencies, larger block sizes are better.
Refresh Rate - (40-200ms)
Determines how often the plugin updates the display in milliseconds. Lower values result in a quicker visual response but increased CPU load.
Average - (1-8)
Applies an averaging algorithm to the spectrum. Higher values give a broader perception of the average frequency content over time. Lower values give a more real-time indication of the spectrum.
Decay - (1-8)
Modifies the decay time of the peak display indicator.
Max dB
Sets the upper limit of the Y-Axis display in decibels. Use this with the Min dB to visually zoom in on the desired area.
Min dB
Sets the lower limit of the Y-Axis decibel display.
Fill - (on/off)
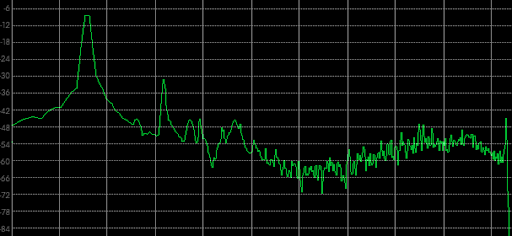
Toggles the display between a line, or filled line graph. This is with fill disabled ...
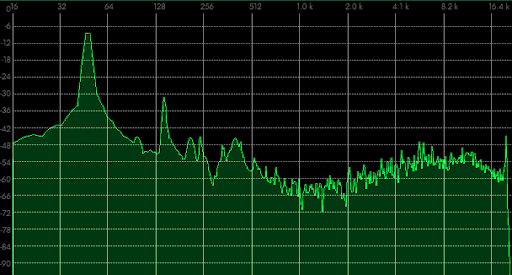
... and this with fill enabled.
Range - (Auto/Manual)
Switches between a manual or automatic range setting for the X-axis. Automatic mode detects the optimal range and sets the min and max dB. Manual mode leaves it fixed to the user’s settings based on the Min and Max dB Controls.
Channel -
Choose which area of the stereo field is visualized in the display. It is set to Mid by default.
L = Left
R = Right
M = Mid - the common frequencies between both sides.
S = Sides - the reverse of mid, so the differences between both sides.
Freeze-
Pause the display window, freezing the spectrum still for static analysis.
Spectro - (Gram/Graph)
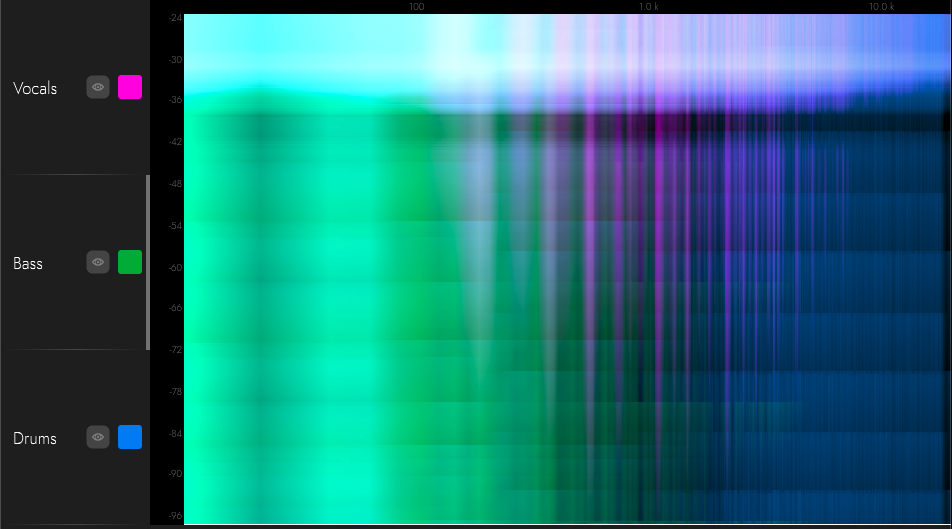
Toggles an overlaid historic spectrogram for all visualized channels. This is useful for getting a longer perception graph.
Spectro Mix
Note: This feature was introduced in 2.22.2395 - make sure to update.
When displaying multiple spectra in the spectrogram, there are different modes for combining the values. First a magnitude (which can be thought of as height) value is computed for each frequency bin in the current spectrum. This magnitude value is then used to determine the opacity of the pixel in accordance to the selected mode. Let's say we're determining the colour value at 100 Hz of a green medium spectrum and a red high spectrum. in additive mode the equation could look like this:
- +: output = 0.5 * green + 0.8 * red = orange (additive blending, saturates to white)
- mix: output = green * (1 - 0.8) + red * 0.8 = red (regular alpha blending)
- max: output = red (because 0.8 is greater than 0.5)
- the other modes are combinations of these.
- + (additive): add the colour values of the different spectra weighted by the magnitudes of the spectra. ordering doesn't matter.
- mix (blend): performs alpha blending based on the magnitude values of the spectra. ordering matters.
- max: show the colours of the spectrum with the highest magnitude at a given frequency. ordering doesn't matter.
- max +: like max, but perform additive blending instead of replacing the colour entirely. ordering doesn't matter.
- max m. (max mix): like max, but perform alpha blending instead of replacing the colour entirely. ordering matters.
Peaks - (On/Off)
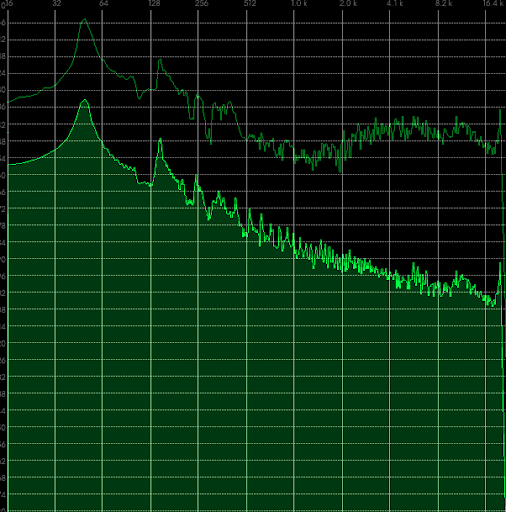
Switches on/off a visual display of the peak of the spectrum.
Log Base - (2/10)
Changes the logarithm multiplier for the frequency axis. Used to change the concentration of frequencies. 2 repeats across octaves, and is better for pitch-based analysis. and is better for low-end analysis. 10 is more logarithmic and better for full-range frequency monitoring.
Slope - (0-3dB)
Changes the decibel sloping of the display to compensate for the Fletcher-Munson curve of the human ear. 0dB has a neutral slope. 3dB applies a slightly equal-loudness contour to give a flatter response.
Resize Handle
In the bottom right corner of the plugin, there is a draggable handle to resize the window.
Click the Schulz logo to visit the website!
16. Conclusion
Thanks for reading this manual. You should now have a solid understanding of the features and settings of Spectrum 2.
We hope you enjoy using this plugin as much as we enjoyed making it.
If you have any questions, please feel free to contact me and ask away!